
Gas Meter Reader

Using a small sensor on the outside of the gas meter, a simple converter board and a Current Cost development board data is fed to a Current Cost Display. The display is connected into a Meteohub weather server via the Current cost USB data cable. Meteohub stores the data and uploads it to Meteoplug where the data can be used to draw graphs in many different formats on PCs, Macs or smart phones. See circuit detail below for info on the sensor and converter board.
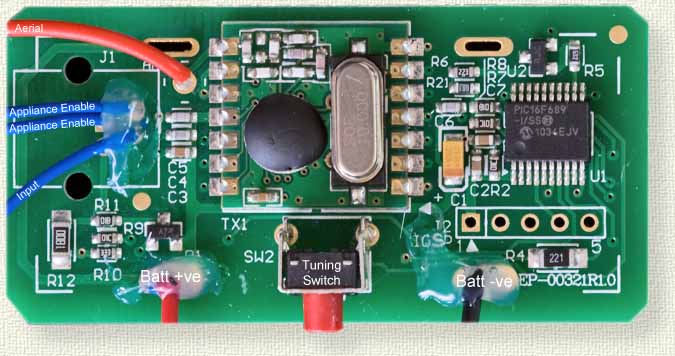
Current Cost Analogue Development board showing external connections
Join the Appliance enable wires together to enable monitoring on the CC128.
For details see the Current Cost Ebay Shop or the Current Cost Technical Blog
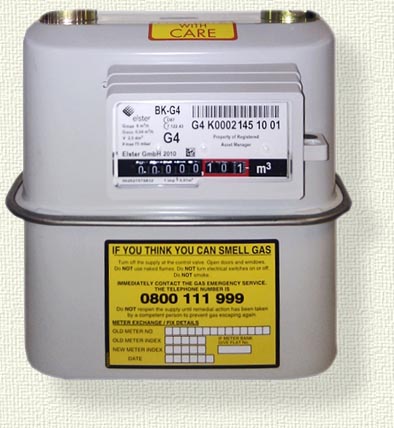
Gas meter
The hall effect sensor is fitted under the case of the meter dial box. The sensor just touches the outside of the meter case. Use a compass to check if your meter works in the same way. Instead of a hall effect sensor a reed relay can sometimes be used.
Some meters have an RJ45 socket that has a meter pulse output or a metal disc on the 1000th dial that can be sensed using a photoelectric switch.
See these blogs for further info
Richard Parker's blog John's Ramblings
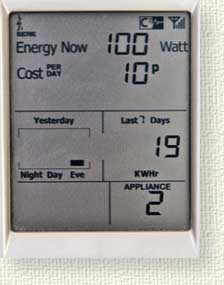
On a complete turn of the 1000th dial the meter emits an electromagnetic pulse. The hall effect sensor picks this up and shows it on the CC128 display in watts. The value is chosen by setting VR2.
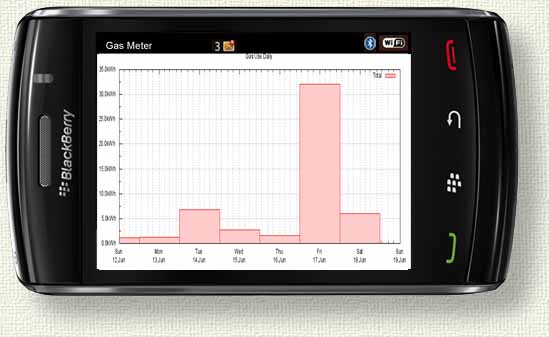
Using Meteohub & or Meteoplug the data can be viewed online using fully customisable charts or tables.

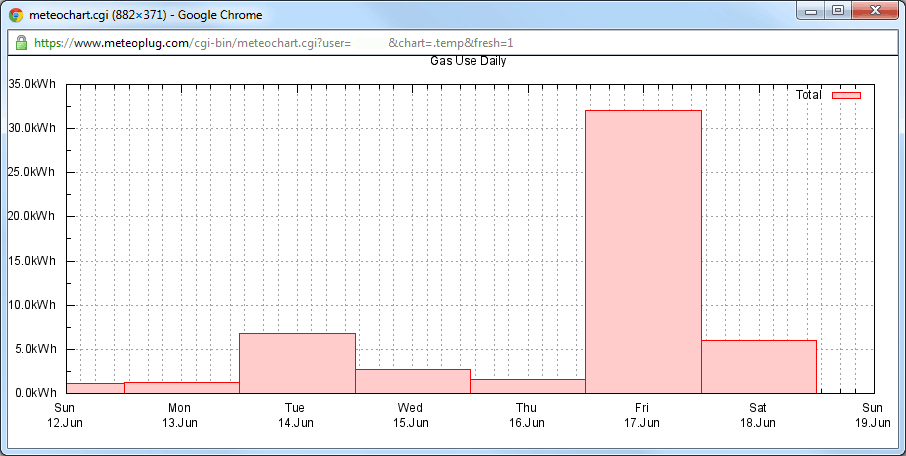
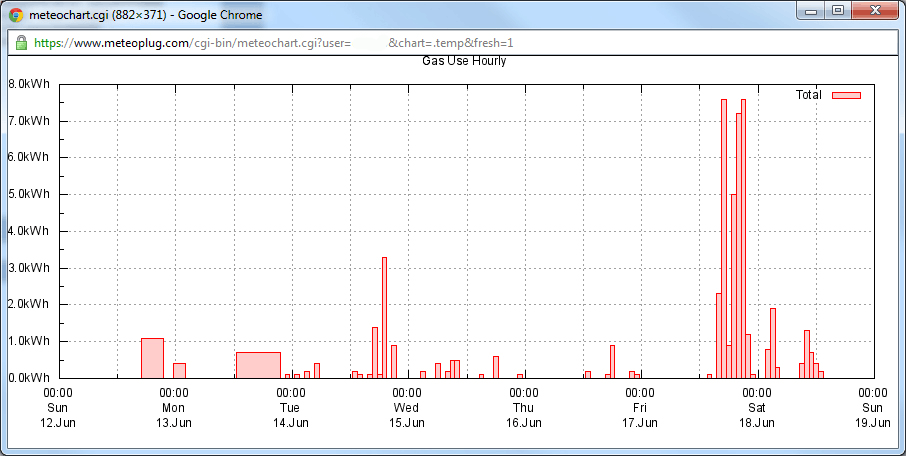
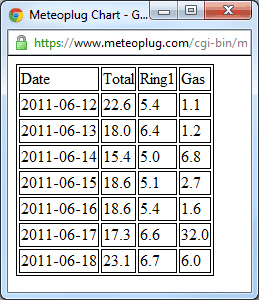
Using Meteoplug you can combine gas & electric charts/tables.
This table shows my Total electric, 1st floor ring main and gas usage.

Meteohub is a miniaturized weather server, that records weather data from your weather station, evaluates this data, draws user defined weather graphs and uploads these via ftp to a web server. Furthermore, Meteohub can upload weather data to Internet weather networks and can export recorded weather data in WSWIN or WD format to allow for further processing on your PC.
Meteohub supports a wide range of weather stations and allows to record these data ongoing and to transport the information to the Internet, without having your PC switched on.

Meteoplug is a client-server approach for logging and processing weather data from automated weather stations located at users' sites. The client application needs minimal storage and computing power, which allows for embedding into "computers" of minimal size and with minimal power demands down to 1 watt (depending on efficiency of power supply it can be 1-2 watts more on mains).
These clients upload weather data to a server on the internet which stores it and provides a broad range of computations and services. The server application is based on a professional database and can handle hundreds of clients simultaneously. Each user has access to his private weather data and the server application acts like being a dedicated device. The server is a full-fledged computer which consumes quite some power, but by being shared by hundreds of users this just adds another 1 watt on total power consumption per user.
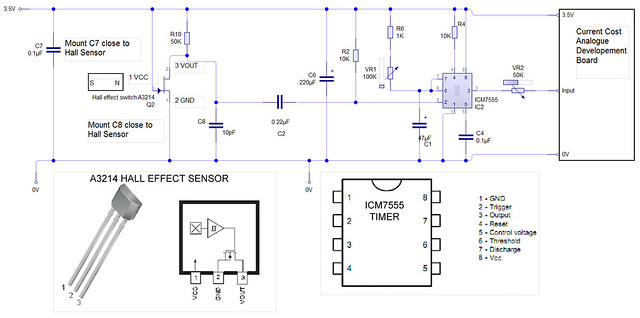
The sensor and converter circuit board schematic showing connections to the current cost development board.
On each complete revolution of the 1000th dial a magnetic pulse is emitted from the gas meter. The A3214 hall effect sensor is triggered and the output drops to zero volts. The change is detected at the input of the ICM555 timer IC via the capacitor C2. C2 prevents the input of the 555 timer IC from being held low if the gas meter dial stops at zero.
The ICM555 timer is configured as a monostable with time set by R6,VR1 and C1. When triggered by the hall effect sensor the output is held long enough for the Current Cost board to send its output to the CC128 display (around 6 seconds). VR2 can be adjusted to display the power level required on the CC128 display. My gas meter 1000th ring turns in around 18 seconds with my boiler on full power so there is plenty of time for the Current cost board to be triggered and released before the next pulse from the 1000th ring.
I used this Hall Effect sensor from Ebay. Item number: 300561065238
At present I run the circuit from a couple of AA batteries to get the 3v required and use a low power version of a 555 timer. I will see how long the batteries last before switching to a mains supply. If mains supply is going to be used then a standard 555 timer could be used instead.

Vero board layout of the converter and sensor board.
